When a website loads slowly, a video call stutters, or game latency spikes, the question is: where in the network is the bottleneck? Traceroute is the most direct tool to answer this. This article goes beyond the basics—starting from the TTL mechanism, through protocol differences, to reading results like a network engineer.
How TTL Makes Traceroute Possible
Every IP packet carries a TTL (Time To Live) field. Despite the name, it’s a hop counter. Each router decrements TTL by 1. When it hits 0, the router discards the packet and sends back an ICMP Time Exceeded message.
Traceroute exploits this: it sends probes with TTL=1, then TTL=2, then TTL=3... Each probe “expires” at the Nth router, mapping the entire path hop by hop.
Three Probe Protocols Compared
| Feature | UDP (Linux) | ICMP (Windows) | TCP |
|---|---|---|---|
| Probe | UDP high ports (33434+) | ICMP Echo Request | TCP SYN (80/443) |
| Detection | ICMP Port Unreachable | ICMP Echo Reply | TCP SYN-ACK or RST |
| Firewall | Moderate | Low—ICMP often filtered | High—ports 80/443 usually open |
| Command | traceroute host | tracert host | tcptraceroute host 443 |
Reading Traceroute Output Like a Pro
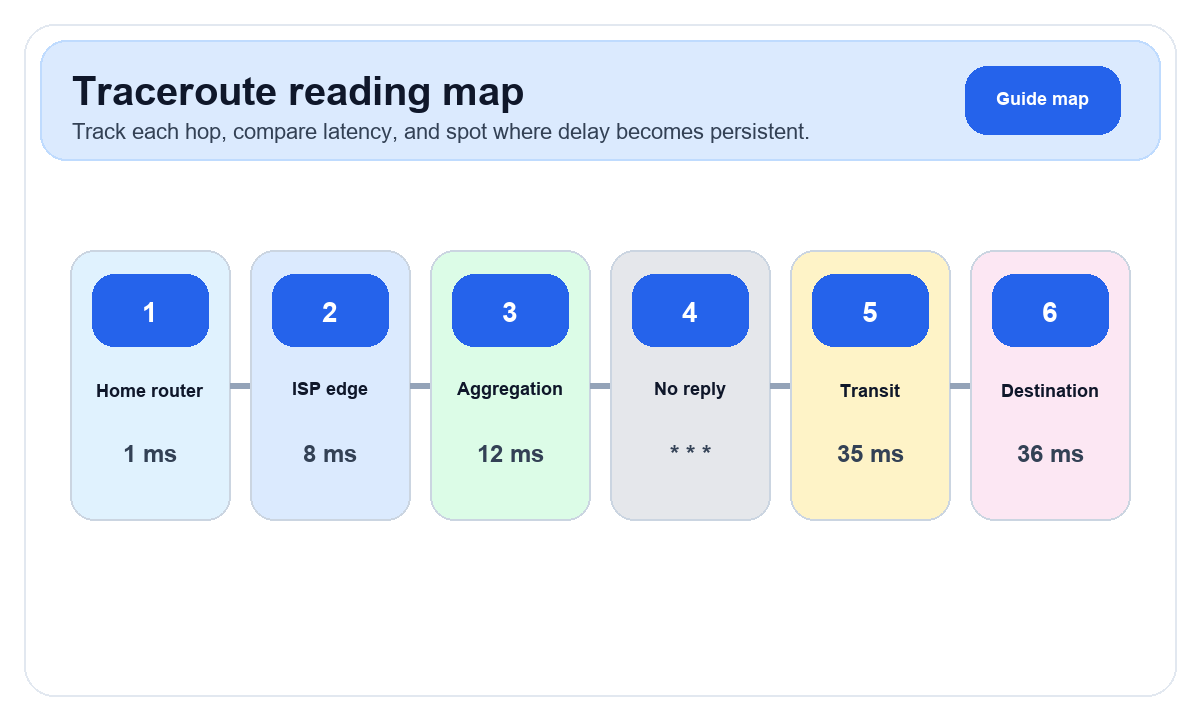
$ traceroute -n 8.8.8.8
 1  192.168.1.1     1.2 ms    0.9 ms    1.1 ms     <-- Your router
 2  10.0.0.1        8.3 ms    7.9 ms    8.1 ms     <-- ISP access layer
 3  172.16.45.2    12.5 ms   11.8 ms   12.1 ms     <-- ISP aggregation
 4  * * *                                           <-- Router not responding
 5  72.14.236.126  35.2 ms   34.8 ms   35.5 ms     <-- Google edge
 6  108.170.241.1  36.1 ms   35.9 ms   36.3 ms     <-- Google backbone
7 8.8.8.8 35.8 ms 35.2 ms 35.6 ms <-- Destination| Pattern | Meaning | Concern? |
|---|---|---|
* * * | Router doesn’t respond to ICMP | ❌ Not necessarily a problem |
| Sudden latency jump | Long-distance link (e.g., transoceanic cable) | ❌ If subsequent hops stay flat, just physical distance |
| Latency stays elevated | Congestion or bottleneck | ✅ Real bottleneck—contact ISP |
| High jitter | Unstable link or packet loss | ✅ Impacts real-time apps |
| Routing loop | Routing misconfiguration | ✅ Serious—packets bouncing |
MTR: The Power of Continuous Tracing
MTR (My Traceroute) combines traceroute and ping, continuously sending probes and reporting real-time stats per hop. Unlike a snapshot, MTR reveals intermittent problems.
$ mtr -n --report -c 100 8.8.8.8
HOST: mypc                    Loss%   Snt   Last   Avg  Best  Wrst  StDev
  1.|-- 192.168.1.1            0.0%   100    1.2   1.1   0.8   3.2    0.4
  2.|-- 10.0.0.1               0.0%   100    8.1   8.3   7.5  12.1    0.9
  3.|-- 172.16.45.2            2.0%   100   12.3  12.8  11.2  45.6    5.1  <-- 2% loss
  4.|-- ???                   100.0   100    0.0   0.0   0.0   0.0    0.0
  5.|-- 72.14.236.126          0.0%   100   35.3  35.1  34.2  36.8    0.5
Hop 3 shows 2% packet loss with occasional spikes to 45ms, indicating intermittent ISP congestion. A single traceroute might miss this entirely.
🔧 Troubleshooting workflow:
pingthe target to confirm loss and latency- Run
mtr -n --report -c 50 target_ip - Find where sustained loss or latency begins
- Look up IP ownership (your network vs ISP vs destination)
- ISP issue → contact with MTR report
- Destination issue → try alt DNS or acceleration
Platform Differences
| Platform | Basic | Advanced | Notes |
|---|---|---|---|
| Linux | traceroute | mtr | UDP default; -I for ICMP |
| macOS | traceroute | mtr (brew) | Same as Linux |
| Windows | tracert | WinMTR | ICMP only |
| Online | ipinfo.im traceroute | — | No install needed |
Common Misconceptions
Myth 1: "Asterisks mean a problem." Many backbone routers disable ICMP TTL Exceeded by default.
Myth 2: "Latency should increase at every hop." Not necessarily—MPLS tunnels and ICMP generation speed vary.
Myth 3: "Traceroute shows the actual data path." Probes may take different ECMP paths than your traffic.